
What is an infographic, how are they made, how is an infographic designed
Infographics is a combination of synthetic, explanatory and easy to understand images and texts in order to communicate information visually to facilitate its transmission.
In addition to the illustrations, we can help the reader more through graphics that can be understood and interpreted instantly.
Although graphic paintings have an existence that dates back many years, infographics (of English informational graphics) have revolutionized design, especially journalistic and editorial. According to Richard Curtis, director of photography and design for the newspaper, "people read the first graphics; sometimes it is the only thing they read."
Infographics are tremendously useful and essential to represent information that is complicated to understand through pure text. With a simple glance you can understand even the most complicated things, and they are also easier to assimilate and remember.
When the objective is to explain, the infographics allow very complicated subjects or contents - that if using verbal elements would be lost in a cluster of words - can be understood quickly and entertainingly and above all in a very visual way that helps understanding.
In this way, the numerical, time, statistical and many other information will be more effective being illustrated than through the pure use of text. In addition, they serve as different elements that allow to grant greater variety and agility to the layout and can be adequately combined with texts and photographs to maximize the understanding of what is being reported.

A good graphic chart should be simple, complete, ethical, well designed and adequate with the information it presents. To do this, you have to make previous sketches that present different possibilities. Subsequently, "we must choose the most appropriate of ideas, the one that most helps the reader and that best combines with the information."
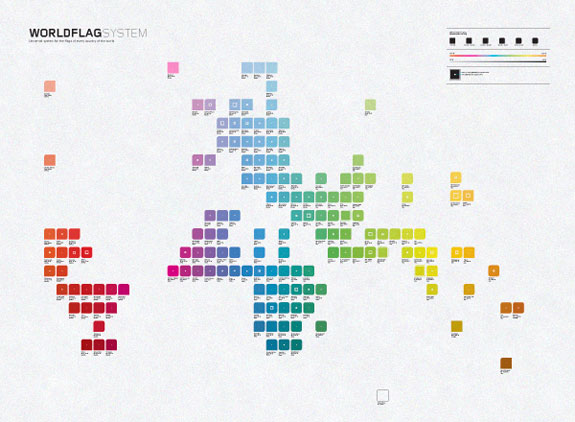
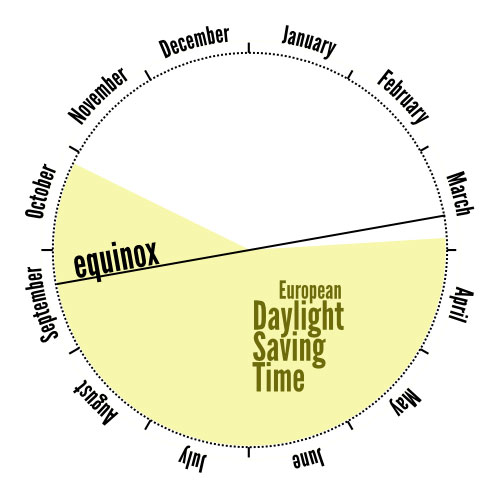
Infographics can be divided into the categories of graphs, maps, tables and diagrams.
The most common applications of infographics are: journalistic infographics, online infographics, architectural infographics, instructional infographics, cartographic infographics.
Writing the story with words and illustrating it with pictures is what a good infographist should do. There are levels for the cataloging of computer graphics and this depends on their ability to work the graphics. Currently, Macintosh computers, with their Freehand and Illustratior programs help organize in illustrating a graphic much more easily than doing it manually. But they require a lot of skill, creativity and critical thinking. Equally, an ability to work in a team, because "the artist, editor and computer must work in harmony to obtain impressive, striking and elaborate informative graphics" And think hard to develop creativity and create new solutions.
When in the article we find the words or phrases budget, plan, agreement, expansion, chronology of events, biographical line, how, what, when, where, key points, key data, future, past, figures, participants, debates, pros and cons, who is who, who is nearby, the victims, the heroes, catalogs, photos, texts, organization, reorganization, police case, escape routes, crime script, etc. But of course, do not overdo it. It's not about doing infographics every time we have those terms, but at least we'll have starting points.
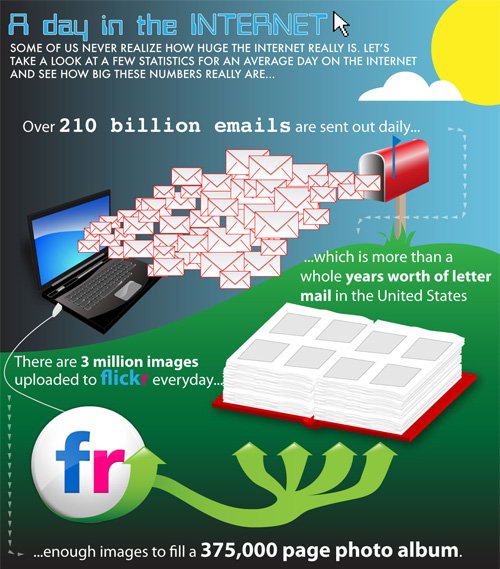
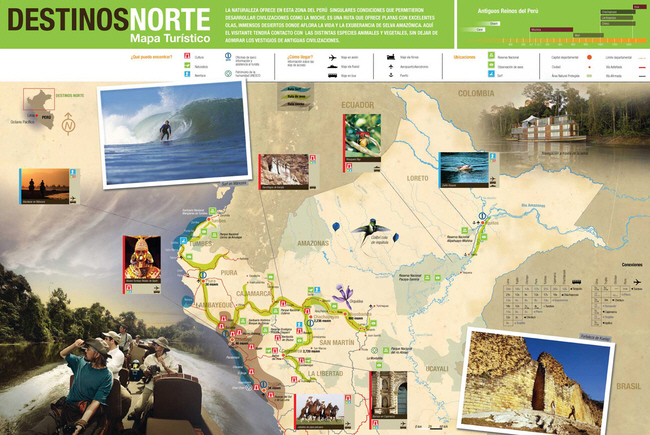
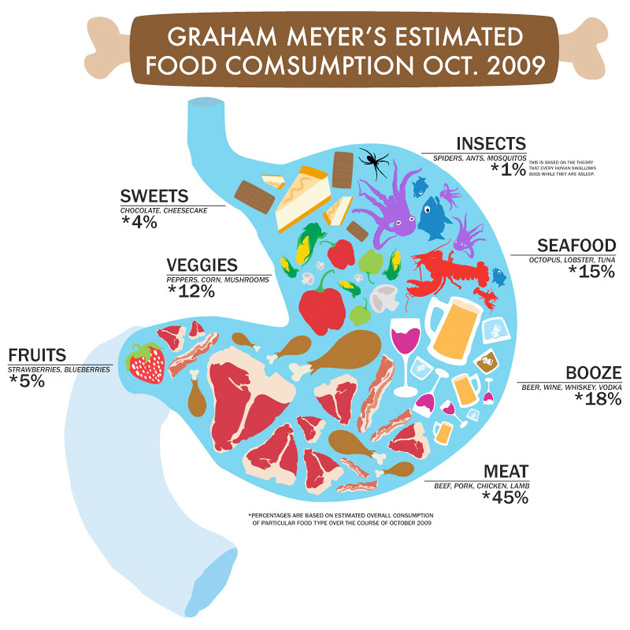
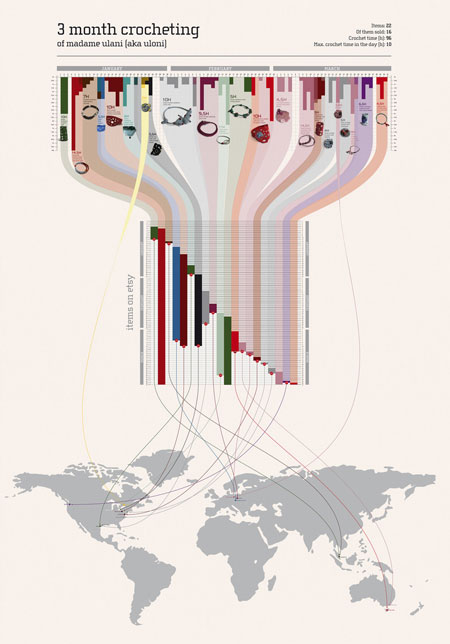
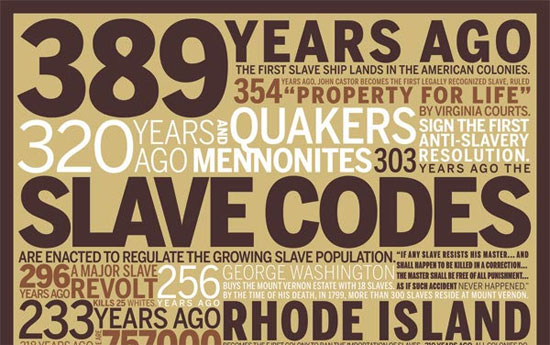
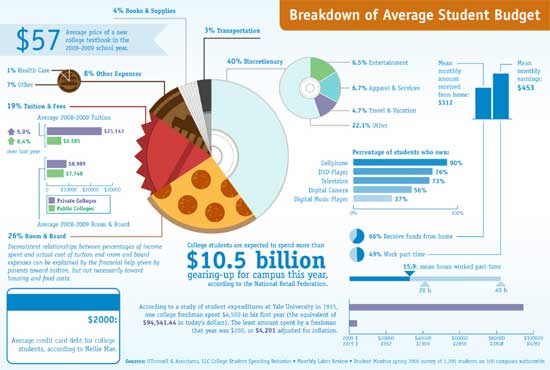
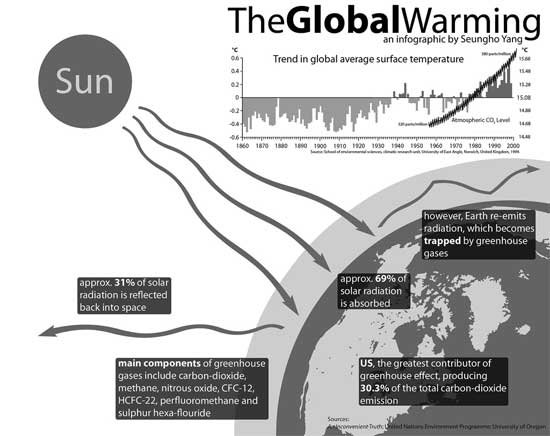
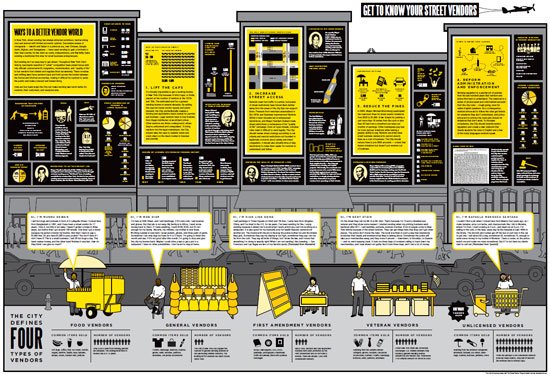
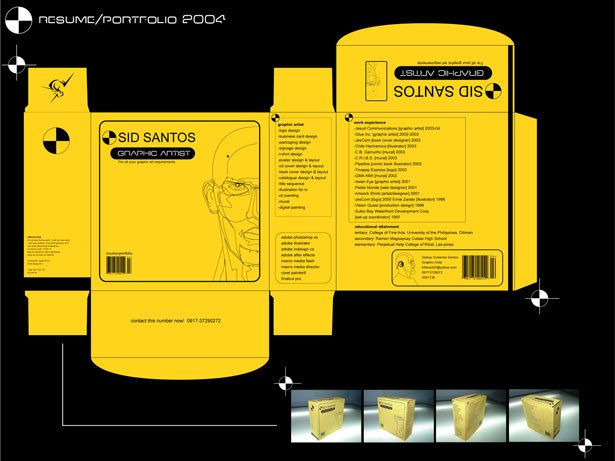
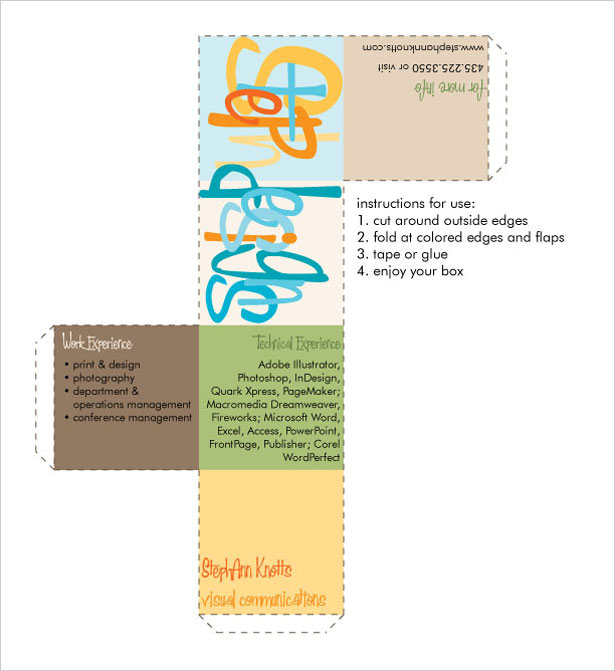
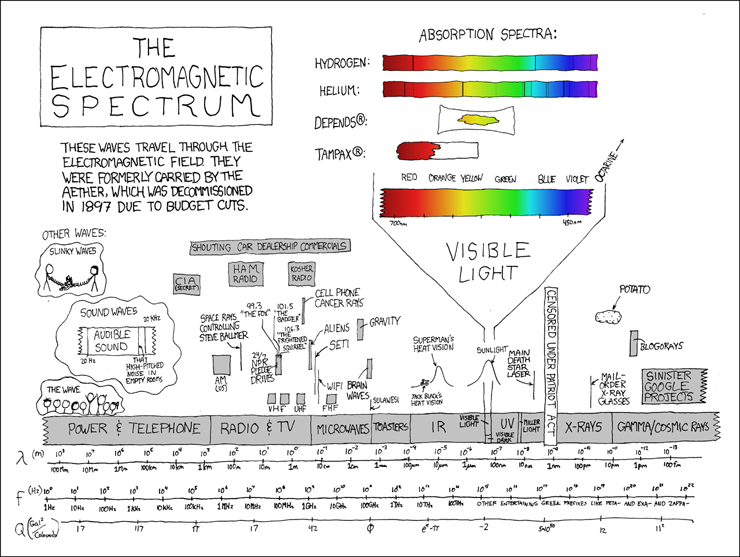
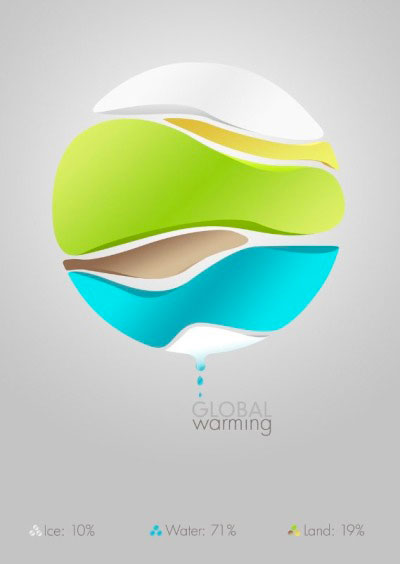
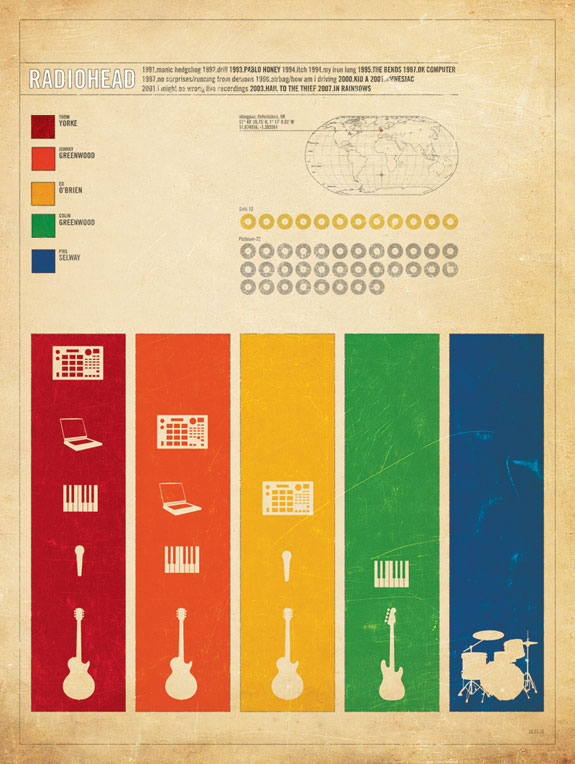
Examples of infographics:


Tags:
create infographics, communicate with infographics, make infographics
Ver más ejemplos de diseño de infografías
- what is infographic how to design infographics
- See examples of architecture infographics
- See examples of cartographic infographics and maps
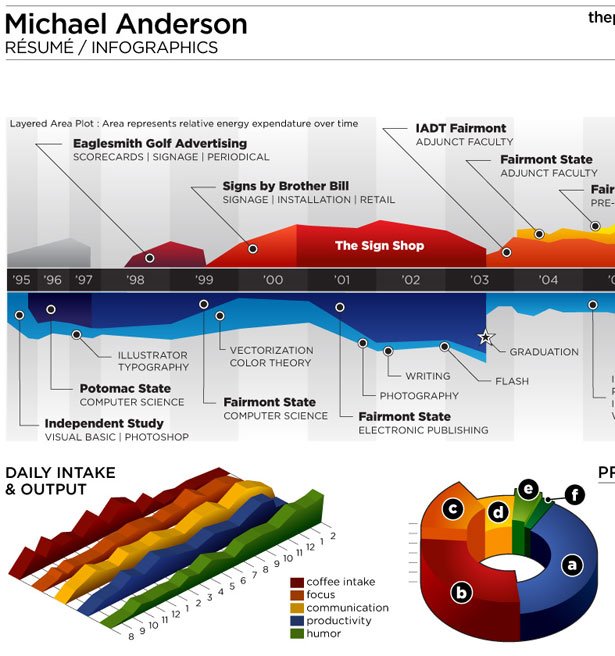
- See examples of curriculum vitae infographics
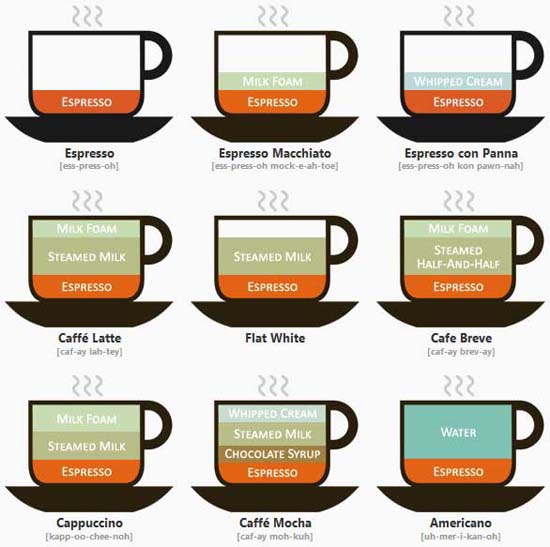
- See examples of descriptive infographics
- See examples of infographics with graphs
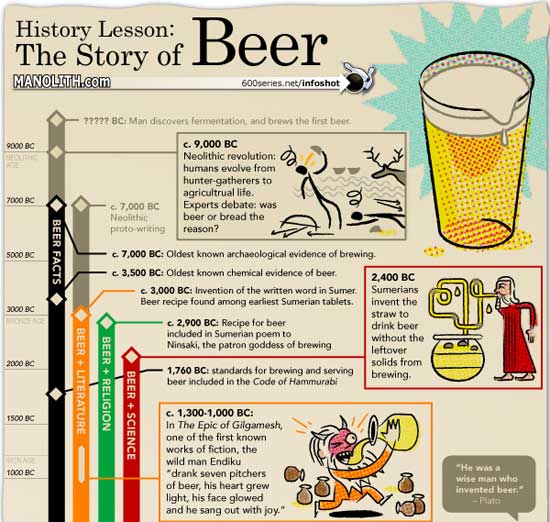
- See examples of historical infographics
- See examples of instructional infographics
- See examples of minimalist infographics
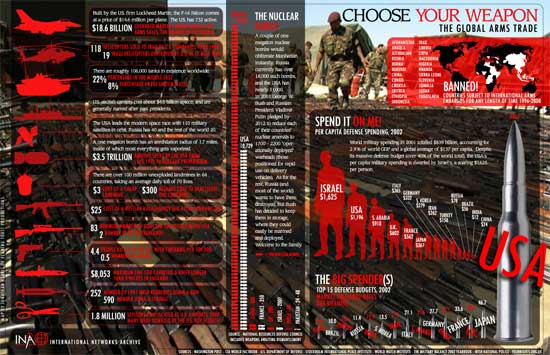
- See examples of journalistic infographics
- See examples of restaurant infographics
- Ideas for ideograms and infographics
- See examples of spectacular infographics, inspiration.
- See examples of spectacular infographics.
- See examples of infographics to get inspired.
- Ideas to create infographics or ideographs.
